BLUF
Problem: Generating diagrams from code has traditionally been slow and inefficient. Maintaining these diagrams even more so.
Solution: Claude reads your codebase → generates C4 diagrams → exports to Structurizr DSL → instant visual architecture.
Time: 30 minutes from codebase to interactive diagram.
Table of contents
Open Table of contents
The Discovery
I needed to understand a complex integration buried in a 100k+ line codebase. Instead of grepping through files for hours, I tried something different.
First, I had Claude read my entire codebase using parallel tasks. Then I described the integration I was looking for in plain English. Claude generated C4 diagrams specifically for that integration, exported them as Structurizr DSL, and I had interactive architecture diagrams in minutes.
This wasn’t a one-off hack. It’s now my standard process for architecture discussions.
The Process: Codebase to Diagram
Step 1: Feed Claude Your Codebase
Use parallel file reading to load your entire codebase efficiently:
# In Claude Code
"Read all Python files in src/, focusing on service boundaries and API endpoints"
Claude will read hundreds of files in parallel, understanding your actual architecture—not what you think it is.
Step 2: Generate C4 Diagrams
Ask Claude to create C4 diagrams from what it learned:
"Generate C4 context and container diagrams for the payment processing system"Claude produces accurate diagrams because it’s working from actual code, not assumptions.
Step 3: Export to Structurizr DSL
The magic moment:
"Convert these C4 diagrams to Structurizr DSL format"Claude generates valid DSL that Structurizr can immediately render.
Step 4: Load in Structurizr
- Open Structurizr Lite or your Structurizr workspace
- Paste the DSL
- Interactive diagrams appear instantly
Pro tip: Use Context7 to load current Structurizr documentation if Claude suggests deprecated syntax.
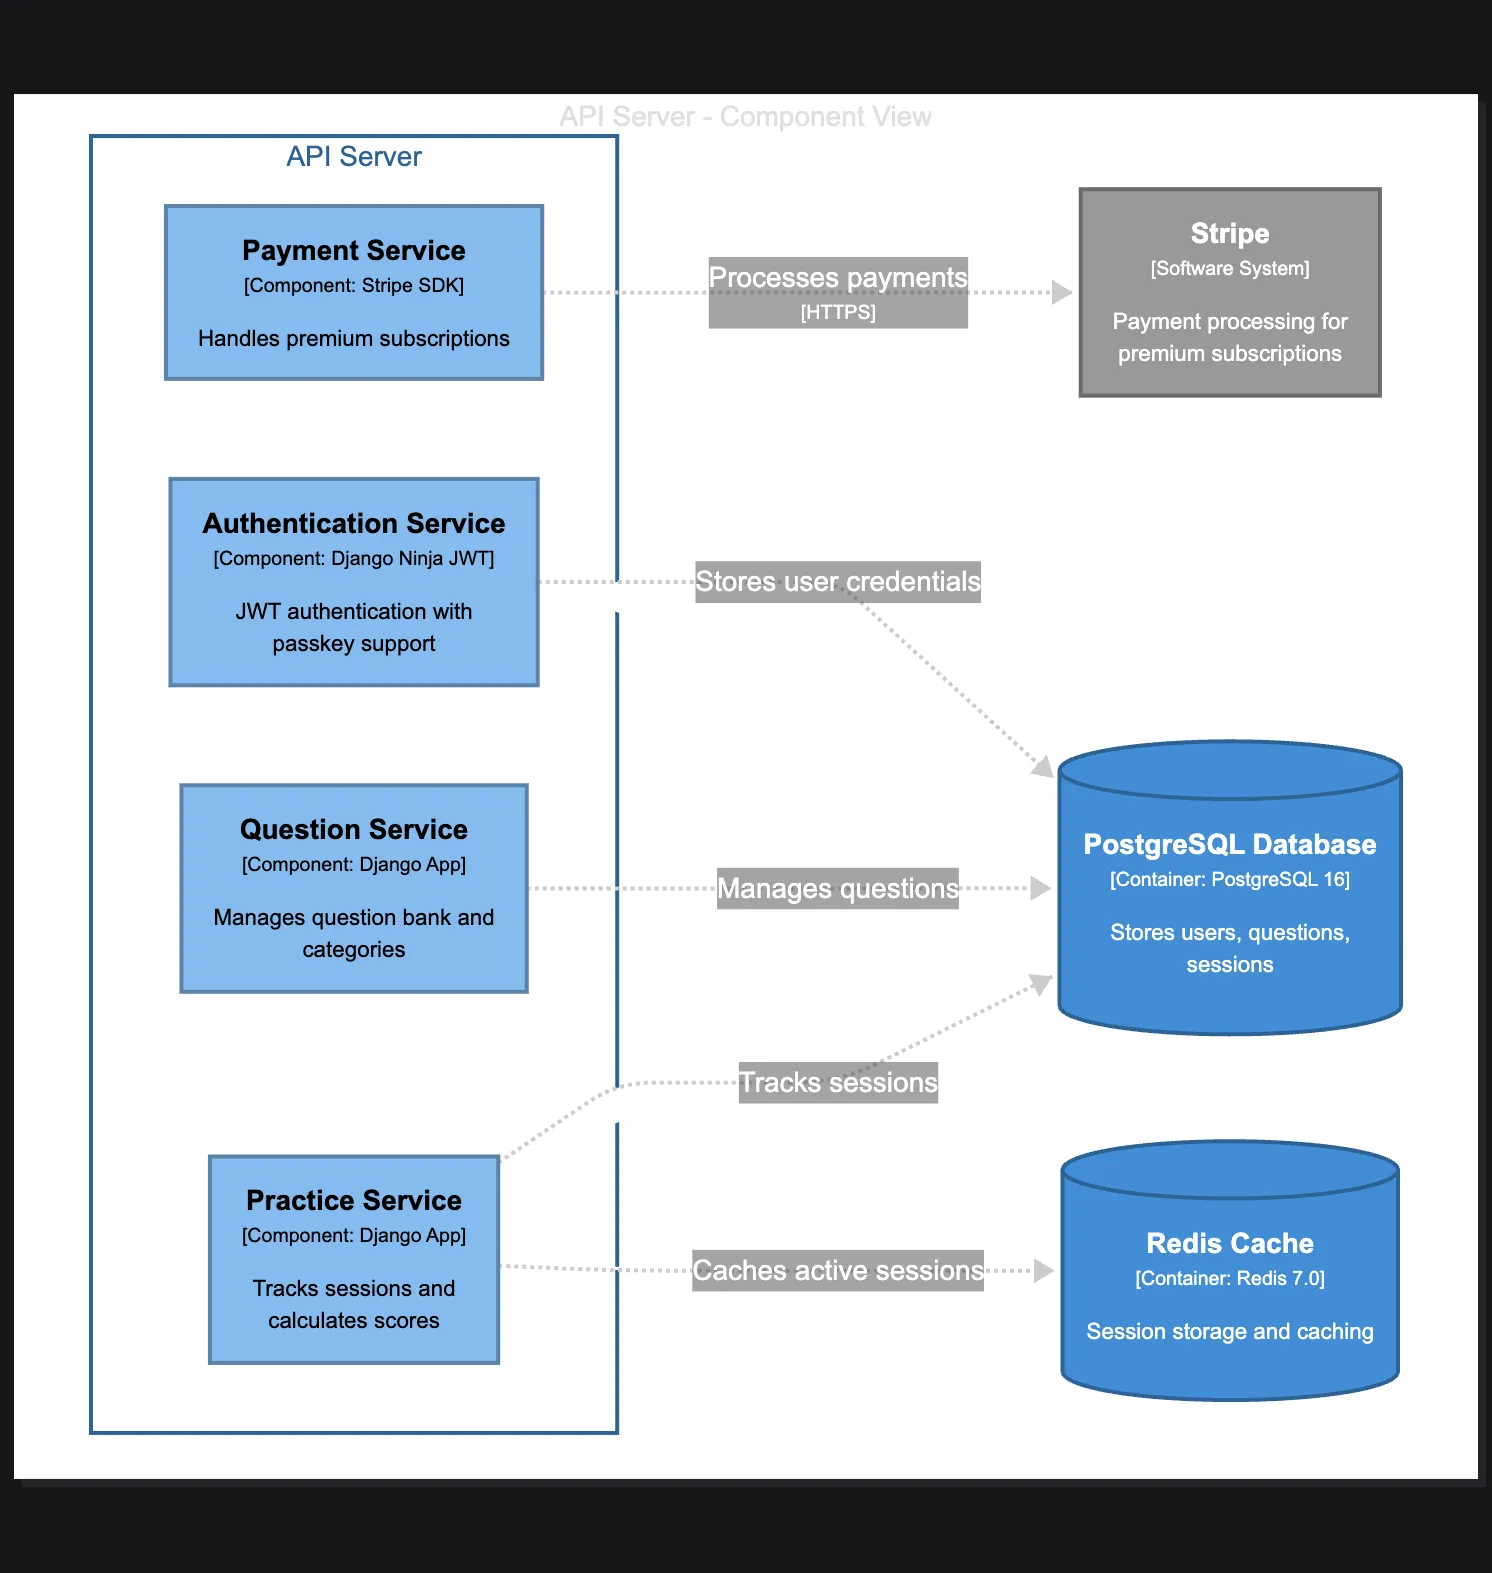
Real Example: NCLEX Practice Platform
I needed to understand how the practice session flow worked in a Django + Next.js education platform.
Claude produced this DSL snippet:
workspace "NCLEX Didi" {
    model {
        student = person "Nursing Student"
        stripe = softwareSystem "Stripe" "Payment processing for premium subscriptions"

        nclexSystem = softwareSystem "NCLEX Platform" {
            webapp = container "Web App" "Next.js 15, React 19"
            api = container "API Server" "Django 5.1, Django Ninja" {
                paymentService = component "Payment Service" "Component: Stripe SDK" "Handles premium subscriptions"
                authService = component "Authentication Service" "Component: Django Ninja JWT" "JWT authentication with passkey support"
                questionService = component "Question Service" "Component: Django App" "Manages question bank and categories"
                practiceService = component "Practice Service" "Component: Django App" "Tracks sessions and calculates scores"
            }
            database = container "PostgreSQL Database" "Container: PostgreSQL 16" "Stores users, questions, sessions"
            cache = container "Redis Cache" "Container: Redis 7.0" "Session storage and caching"
        }

        student -> webapp "Practices questions"
        webapp -> api "API calls"

        paymentService -> stripe "Processes payments [HTTPS]"
        authService -> database "Stores user credentials"
        questionService -> database "Manages questions"
        practiceService -> database "Tracks sessions"
        practiceService -> cache "Caches active sessions"
    }

    views {
        component api "API_Components" {
            include *
            autolayout lr
        }
    }
}
The diagram revealed the actual JWT auth flow, Redis caching strategy, and how practice sessions are tracked—details buried across multiple Django apps.
Why This Changes Everything
Instant Focus
Describe what you need in English. Get diagrams for exactly that subsystem. No noise.
Living Documentation
Re-run the process after major changes. Diagrams stay current because they’re generated from source.
Consensus Builder
Show the actual architecture in meetings. Skip the theoretical debates. The code doesn’t lie.
Advanced Patterns
Drill-Down Diagrams
Start broad, then focus:
"Show C4 context for entire system"
"Now create container diagram for just the auth service"
"Show component diagram for the JWT validation"
Migration Planning
Visualize before/after states:
"Generate current state C4 diagram"
"Now show what it would look like if we extracted the reporting module"
You could even diagram out various architecture options to discuss pros and cons.
Gotchas and Pro Tips
Generate One Diagram at a Time
Claude can make mistakes when generating complete C4 documentation. Start with the system context, validate it works, then ask for the container diagram. This incremental approach catches errors early.
"First, just generate the C4 system context diagram"
[validate it compiles]
"Now add the container view"
[validate again]
"Add the component diagram for the API"
Hand-Edit the DSL
Structurizr DSL is surprisingly readable. When Claude makes small errors (duplicate relationships, wrong references), it’s often faster to fix them yourself than to ask Claude to regenerate:
# Easy to spot and fix issues like:
api -> stripe "Processes payments"  # Delete if duplicate
webapp -> api "API calls"           # Simple to modify
The DSL syntax is intuitive—relationships are just source -> destination "description". You’ll save time by making quick edits rather than regenerating everything.
Human Review is Non-Negotiable
The human review takes the most time in this process—but it’s unskippable. Claude will confidently generate diagrams that look right but miss critical relationships or include phantom services. You need to verify:
- Does this match what’s actually in production?
- Are all the key integrations shown?
- Is anything missing or incorrectly connected?
This review step is where the real value emerges. You’ll spot architectural issues, missing documentation, and opportunities for improvement that neither you nor Claude would have noticed without the visual representation.
Key Takeaways
- Parallel reading handles massive codebases
- Generate incrementally - one C4 level at a time
- Structurizr DSL is human-readable and easy to fix
- Hand-editing DSL is often faster than regeneration
Let the diagrams drive consensus. Your next architecture discussion could be your shortest.